| Silver Creek Observatory | ||||||||||
| Morganton, North Carolina, USA N 35.71 W 81.75 1109' MSL | ||||||||||
|
||||||||||
|
|
||||||||||
|
||||||||||
|
Photo taken at 2:55pm EDT on 04/22/2005 along US 64 at Burke/McDowell County Line
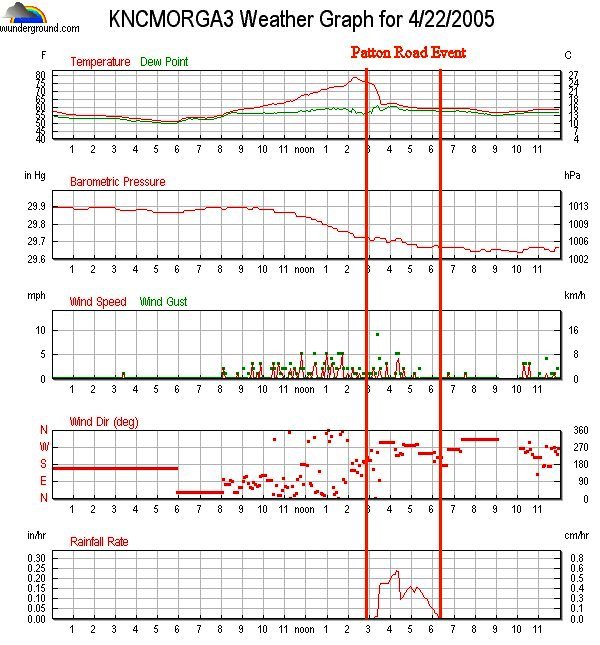
The afternoon of Friday April 22, 2005 looked like a good day to go out for a ride and observe the developing storms. My wife Dana and I, along with our Siberian Husky "Tempest" jumped into our Ford Ranger with our camera equipment to do just that. After leaving our house we traveled southwest on US Highway 64 to a point near the Burke/McDowell County line. The storm clouds began to look very menacing (see photo above) so we stopped in the parking lot of a small country store (see map below). We also needed some snacks for the drive (pork rinds are Tempest's favorite). I got out of the truck at about 2:45 pm EDT to get a better view of the storm and take a few pictures. From our location it looked very impressive, but there was very little wind, and no rain or thunder the few moments that we observed and photographed it. It was later that we learned of the damage that the storm had caused along Patton Road in western Burke County. According to the news reports many trees were damaged and intense rain had fell (view article by clicking button at bottom of page). The local residents thought that it might have been a tornado, but that has not been confirmed. Another more likely cause was a thunderstorm microburst. So I am just going to call it an event; something happen but we don't know what exactly. We checked our weather station's (KNCMORGA3) data for that time period (see graphs below) to see if it had recorded any extreme values during the storm's passage. The data showed only light winds and fairly normal rainfall rates for the period. By looking at the first graph you can see the temperature fell to meet the dew point due to the cloud cover and rainfall from the storm. The next graph shows the barometric pressure falling, another indication of a change in the weather. The third and fourth graphs show the wind data( highest gust was 9 mph), rather unimpressive for such a mean looking storm. The final graph shows rainfall rates, the highest at one point was almost 0.25 in/hour. That was not as great as I would have expected for a storm like this. A couple of days after the event we drove through the affected area and spotted the trees down along Patton Road that had been knocked down by the storm. Pretty sporadic damage, just here and there. By looking at the map, you can see the relative direction and distance of the area the event occurred in from our position and that of the SCO Weather Station. It is amazing that 60+ mph winds, hail and damage were occurring almost directly between us and our home weather station, yet at both locations the conditions were relatively calm. Just goes to show how isolated severe weather can occur in a small area, while not greatly affect other nearby places.
|
||||||||||
|